Welcome. We’ll be starting a new course thread on the website on Probability and Statistics.
This course gives an introductory introduction to probability and statistics with applications. Topics covered will be:
- Basic combinatorics
- random variables
- probability distributions
- Bayesian inference
- hypothesis testing
- confidence intervals, and
- linear regression
The full syllabus will be as follows:
Theoretical Probability –
- Random variables, quantiles, and mean variance are all terms that may be used to describe random variables, distributions, and quantiles.
- Bayes’ theory, base rate fallacy, and conditional probability
- Covariance, correlation, and independence are all terms that have been used to describe joint distributions.
- Theorem of the Central Limit
- Probability intervals, Bayesian inference with known priors
- Bayesian inference with unknown priors
- Confidence intervals
- Resampling methods: bootstrapping
- Linear regression
- A mathematician is terrified of flying because of the remote possibility of a terrorist attack. As a result, he brings a bomb with him on every flight. “The chance of a bomb on a plane is very low,” he reasoned, “and the possibility of two explosives on the same plane is nearly nonexistent.”
- My house was raided, and officers carried away books on algebra, trigonometry, and calculus, as well as dice and other probability-demonstrating items. They said it was weapons of math instruction.
Applied probability –
Course Goals :-
Learn the vocabulary and fundamental ideas of probability theory.
Understand the fundamentals of statistical inference (both Bayesian and frequentist).
Create a basic statistical toolkit that recognizes both the value and limitations of these approaches.
To perform statistics, use software and simulation (R).
Learn to be an informed consumer of statistical data.
Students will be able to:
– To determine probability and chances, use fundamental counting techniques (multiplication rule, combinations, permutations).
– R may be used to conduct simple simulations of probabilistic scenarios.
– Check for event independence by computing conditional probabilities directly and using Bayes’ theorem.
– Create and manipulate discrete random variables. Understand the Bernoulli, binomial, geometric, and Poisson distributions in particular.
– Work with random variables that are continuous. Understand the characteristics of uniform, normal, and exponential distributions in particular.
– Understand and be able to compute expectation and variance.
– Learn about the law of big numbers and the central limit theorem.
– Calculate the covariance and correlation between variables that are jointly distributed.
– Make and understand scatter plots and histograms.
– To compute posterior distributions and posterior chances, use Bayesian updating with discrete priors.
– Determine plausible confidence intervals for parameter estimations.
– To evaluate the significance of results, use null hypothesis significance testing (NHST), and interpret and compute the p-value for these tests.
– Use specific significance tests such as the z-test, t-test (one and two samples), and the chi-squared test.
– Calculate the confidence intervals for parameter estimations.
– To estimate confidence intervals, use bootstrapping.
– Simple linear regression between two variables may be computed and interpreted.
– Set up a least-squares data fit.
What is Probability? Why learn it?
Probability and statistics are areas of mathematics that deal with the rules that govern random events, as well as the gathering, analysis, interpretation, and display of numerical data. Probability originated in the 17th century with the study of gambling and insurance, and it is today an important tool in both social and scientific sciences.
Statistics may be traced back thousands of years to census counts; nevertheless, as a unique scientific field, it was created in the early nineteenth century as the study of populations, economies, and moral acts, and later in that century as a mathematical instrument for evaluating such data.

Theoretical probability
Probability theory is a branch of mathematics that focuses on random occurrences. The likelihood of something happening is the proportion or fraction of times a specific result is likely to happen.
A random event’s outcome cannot be predicted before it occurs.
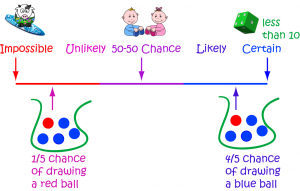
The probability of chance will determine the real outcome. The probability of chance is represented in probability theory by a numerical number between 0 and 1 that represents how probable an event is to occur. A probability of 0 implies that an event is unlikely to occur, whereas a probability of 1 suggests that it is certain to occur.
There are several methods for calculating the likelihood of an occurrence. One approach is to guess the event’s likelihood. For example, assuming a coin is fair, we may estimate that there is a 0.5 (12 or 50% ) probability that heads or tails will occur on a particular coin flip.
However, if we flip a coin many times and observe and collect a large amount of data and discover that the coin lands on heads 75% of the time, we may conclude that the coin is not fair and is skewed towards tails, assuming that our data collection and the observed probability are well substantiated.
Is statistics the same?
Statistics is a branch of mathematics that deals with the collection, organization, display, analysis, interpretation, and presentation of data. It is frequently utilized in scientific study, societal concerns, and industrial applications, among many other things.

On the most basic level, it entails appropriate data collecting by sampling if full census data cannot be gathered, planning and executing experimental and observational research, and drawing findings or re-designing studies based on the data.
Software:
We shall be using the programming language R to demonstrate a few probability simulations. R is a free open-source language, which is very easy to use and install.
https://www.r-project.org/
Probability helps us to solve questions like “What is the probability of getting exactly 1 head in 3 tosses of a fair coin?”
We know that the probability of a head in a fair coin = 50 % = 0.5
Thus, getting 1 head in 3 tosses = 0.5^3 = 0.125
Set operations
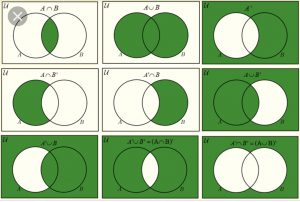
It is very important to know set operations before dealing with questions in probability. Say we have two sets:
A = {1,2,3,4}
B = {2,4,6,7}
Then all the operations we can perform on these sets are:

It’s also important to know that product of two sets, S × T = {(s,t)} is a tuple of two elements.
As a task, try a few of these questions:
1. In the 100m final, there are ten competitors.
How many ways may gold, silver, and bronze be given out?
2. What is the chance of exactly three heads in ten flips of a fair coin?
Let us know in the comments if there is anything you are having trouble with regarding the topics, and we’ll clear it out on the next article.
To end the introduction, here are a few probability jokes to lighten up your day!
— *** —
Arkaprabha Majumdar