Linear algebra is an expansive subject. But I’m going to try to cover the required pieces here that will help you get your journey underway.
System of coordinates in linear algebra
The data includes, in total, an array of numbers. Spatial data is similar, but it also contains numerical information that assists you to find it on Earth.
These numbers are part of a coordinate system that provides a frame of reference for your data to position features on the surface of the earth, align your data with other data, conduct spatially correct analysis and create maps.
The arrangement of reference lines or curves used to establish points’ locations in space is a Coordinate Scheme.
Points are marked by their distance from the reference point in the horizontal (x) and vertical (y) axes, middle, center (0, 0).

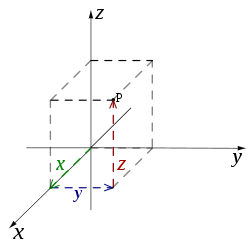
As you can see, Cartesian coordinates for three (or more) dimensions can also be used.
The Cartesian x-y-z scheme, however, is not the only system of coordinates. Additional common systems include:
- Polar Coordinate System Polar System
- System of Cylindrical-coordinate, and
- Systems with spherical coordinates

Vectors and Dimensions
So on a number line, all data points that appear like a single number can be interpreted. The best description of a communication scheme is the recognition of points on a line of real numbers using the number symbol.
The 2D data is represented by the shape (x,y) and can be represented by two axes.
The 3D data is represented by the form (x,y,z) and can be represented by three axes.
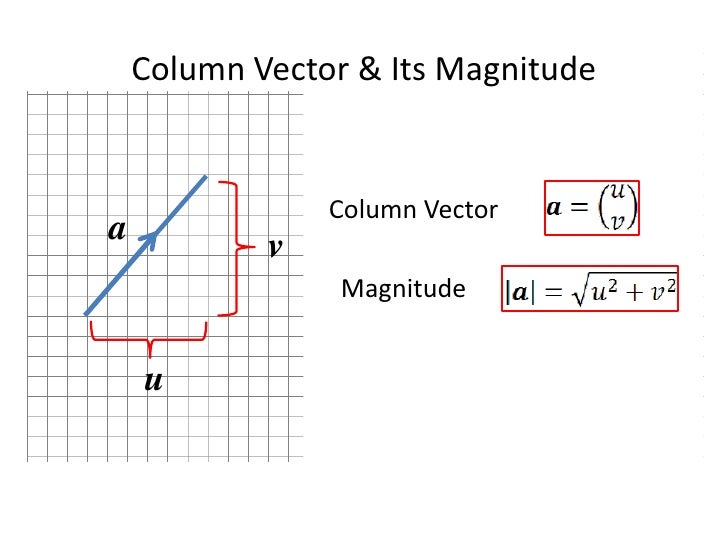
Data, known as vectors/tuples, is stored as a finite ordered list (sequence) of elements.
The number of elements within a vector is known as a vector’s dimensionality or dimension.
Every array of numerical data in a dataset will then be a vector. The vector (1,2,3,4) is considered to be a four-dimensional (4D) vector, and understanding this will allow you to realise that the data can be several hundred dimensions depending on the amount of features in the data, even though it can not be accurately visualised in 3D space.

Bioinformatics datasets for genome sequences, for example, have hundreds of characteristics. Similarly, text data has a minimum of 3000 characteristics when vectorized.
Random Variables
You may describe a random variable as a functional mapping from an event’s sampling space to a line of real numbers.
A random variable can be either continuous or discrete in Linear algebra.
A countable number of distinct values are carried on by discrete random variables. Consider an experiment where a coin is tossed three times.
If X represents the number of times the coin heads appear, then X is a random differential variable which can only be 0, 1, 2, 3 (from no heads to all heads in three consecutive coin tosses). No other value is viable for X.
Over a given range or interval, continuous random variables can represent any value and can take on an infinite number of potential values. An experiment involving calculating the amount of rainfall in a city will be an example of a constant random variable.
System of Linear Equations
From learning equations, the subject of algebra emerged.
We would try to find all the exact numbers x, for instance, so that x2 − 4 = 0.
We should rewrite our equation as (x − 2)*(x + 2) = 0 to solve, and then consider the left-hand side. So we will infer that either x = 2 or x = −2 because zero needs to be either x − 2 or x + 2.
However, it is a nonlinear question to find the roots of a polynomial, while the subject to be studied here is the linear equation principle.
The simplest linear equation is the equation ax = b. The letter x is the
variable, and a and b are fixed numbers. For example, consider 5x = 10.
The solution is x = 2.
We’ll also go through more linear algebra in further sections, so bookmark the page and keep yourself updated !